
Digitalisation of the agri-food industry: by layers and by phases
Automation · Industrial digitalisation
Agri-food industry digitalisation means plant data being captured automatically, once and at source, and reaching whoever needs it at the pace they need it: the operator, in seconds; the production manager, per shift or per batch; management, week by week. It is done in layers, from the sensor and the programmable logic controller (PLC) to SCADA, from SCADA to the manufacturing execution system (MES) and from there to the ERP. Each layer depends on the one below delivering reliable data, and connecting machines, control and management in this way, so that information flows without anyone typing it in, is what is usually called Industry 4.0.
That is why you start at the bottom and start small: one line, one problem that is already costing money and one indicator that can be measured before and after. At ER Ingeniería we have been working in industrial automation since 1981 and have automated 45 agri-food factories. The question we open every project with is always the same: what data is missing today to make better decisions, and which machine it has to come from.
The short version: before talking about software, take an inventory of signals: what the plant already measures, what is written down by hand and what nobody measures. The first phase of a digitalisation project should fit into one line and one indicator. If it works, it is extended on the same architecture.
On this page
The layers of a digitalised plant: from sensor to ERP
The reference model for organising a factory into layers is the ANSI/ISA-95 standard, adopted as an international standard under the number IEC 62264 [1][2]. It divides the enterprise into levels: the physical process (level 0), sensors and actuators (level 1), control and supervision (level 2), manufacturing operations management (level 3, where the MES works) and business planning and logistics (level 4, ERP territory). Its core part defines how information is exchanged between levels 3 and 4, that is, between the plant and the office [2]. SCADA straddles the two: it supervises control in real time (level 2), and ISA itself lists it alongside MES among the systems that manage manufacturing operations [1].
Thinking this way helps because each level works at a different pace and is used by different people. Mixing them up causes many of the problems we see: an ERP is not built to receive a temperature every second, and an operator does not need the month's margin on their screen.
| Layer | What it contains | Data it provides | Who uses it | Typical pace |
|---|---|---|---|---|
| Field (level 1) | Sensors, load cells, flow meters, probes, power analysers | Weight, flow, temperature, level, pressure, kWh | The PLC, not a person | Continuous |
| Control (level 2) | PLCs, drives, remote I/O | Motor and valve states, sequences, recipe in progress, alarms | Maintenance and programming | Milliseconds |
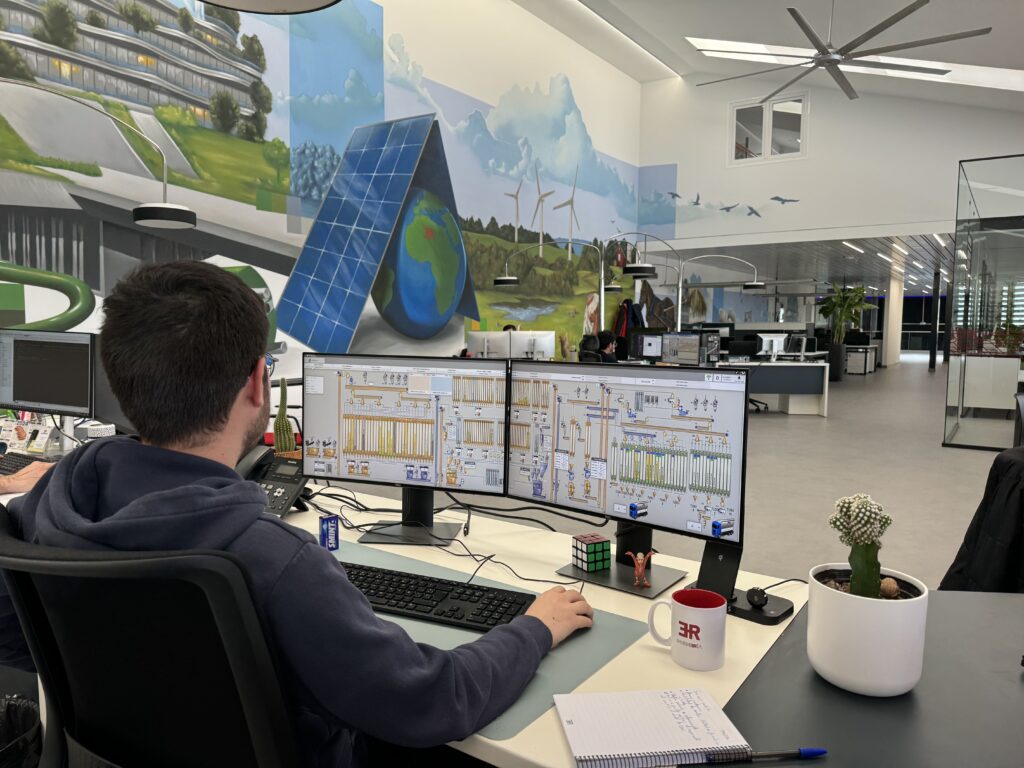
| Supervision (levels 2 and 3) | SCADA, operator screens, historians | Mimic diagrams, alarms, trends | Operators and shift supervisor | Seconds to minutes |
| Operations (level 3) | MES, traceability, production reports | Executed orders, actual consumption per batch, stoppages, waste, OEE | Production, quality and maintenance | Per batch, shift or day |
| Enterprise (level 4) | ERP | Orders, purchasing, stock valuation, costs | Management, purchasing and administration | Days, weeks and months |
What each piece does on its own is explained in what is a PLC and in SCADA systems in agri-food plants.
Where to start digitalising an agri-food plant
At the bottom. An MES or a dashboard can only show what the PLCs and sensors give it. If a weighing scale is not connected, if a line's PLC does not store the reason for a stoppage or if electricity consumption is only known from the bill, the software at the top will fill up with data typed in by hand, which is exactly what you wanted to get rid of.
The first task is an inventory of signals on the chosen line. For each piece of data you want (kilos dosed, minutes of downtime, kWh, the temperature of a tank), note where it comes from today:
- It is already in the PLC and just needs to be read and stored.
- It is in a device with communications (a scale, a power analyser, a drive) that nobody has connected.
- It is written down by hand on a report sheet or in a spreadsheet. This is almost always where the improvement lies.
- Nobody measures it, and you need to decide whether it warrants a sensor.
That inventory also shows the state of the foundations. A PLC with no spare parts or a SCADA that no longer accepts updates is not a good base; sometimes the first phase consists of renewing them, and we explain this in the PLC upgrade guide and in the article on SCADA and PLC modernisation. The full method for automating a plant from scratch is in how to automate an agri-food plant.
What indicators a digitalised plant gives you
The best-known indicator is overall equipment effectiveness, or OEE. Its standard definition is in ISO 22400-2, which covers key performance indicators for manufacturing operations management, and it is the one used in specifications such as OPC UA for Machine Tools [3]. It is calculated by multiplying three ratios:
OEE = availability × performance × quality
- Availability: the time the line has been producing, divided by the time it was planned to produce.
- Performance (the standard calls it effectiveness): what was produced in that time compared with what would have been produced at the planned cycle time.
- Quality: good product divided by total product.
A typical scenario, with round numbers: a packaging machine with 8 planned hours per shift that loses 1 hour to format changeovers and breakdowns has an availability of 7/8, or 87.5%. If in those 7 hours it packs 90% of what its planned cycle time would allow and 98% of what it packs is good, the OEE is 0.875 × 0.90 × 0.98, or 77% rounded. What is useful is knowing which of the three factors is pulling it down, and you can only know that if stoppages, speed and rejects are recorded automatically and with their cause.
OEE is also a good example of why the layers have to talk to each other. The OPC Foundation specification itself warns that planned time and the planned cycle time per unit do not usually come from the machine, but from the MES or the ERP [3]. Without that planning data, the machine has nothing to calculate its OEE with.
In the agri-food industry there are other indicators that often matter as much as OEE:
| Indicator | How it is calculated | Which layer it comes from | Purpose |
|---|---|---|---|
| OEE per line | Availability × performance × quality [3] | Control (states and counters) and operations (stoppage causes) | Knowing whether the problem is stoppages, speed or quality |
| Specific energy consumption | kWh, or m³ of gas, per tonne, per litre or per batch | Power analysers per line and actual production for the same period | Comparing lines, shifts and recipes; seeing consumption with the line idle |
| Waste or formula deviation | (actual consumption − theoretical consumption) / theoretical consumption, per ingredient and batch | Scales and dosing units, against the recipe | Seeing where raw material is lost and whether a dosing step is drifting |
| Downtime by cause | Minutes of downtime classified by reason | PLC (state) and operator (reason, if the machine does not know it) | Deciding what to improve first in maintenance and format changeovers |
Specific energy consumption works the same way as OEE: the kWh comes from a power analyser and the tonne from the production record. To calculate it you need to measure per line or per process, not just at the factory's main meter, and cross-reference that measurement with actual production over the same period. Only then can you see how much of the spend goes on start-ups, cleaning or waiting time.
Integration with the ERP: what goes down and what comes up
In a food or feed factory, the exchange between plant and enterprise set out by ISA-95 [1] runs in two directions:
- From the ERP down to the plant goes what is to be produced: production orders, formulas or recipes, available raw material batches and orders to be shipped.
- From the plant up to the ERP comes what has actually been produced: quantities, actual consumption per batch, waste, times and dispatched batches.
Two rules prevent many integration problems. First, each piece of data should have a single owner: the item master and the stock valuation belong to the ERP; recipe execution and actual consumption belong to the plant. A formula maintained in two places ends up with two versions. Second, use open standards wherever possible. OPC UA, from the OPC Foundation, is a service-oriented, platform-independent architecture with security controls such as encryption, authentication and auditing [4].
Batch traceability is where integration shows most, because it cuts across every layer: the raw material batch is registered at goods-in, consumed in the plant and leaves in a shipment. What the regulations require, and where it fails when it relies on paper, is covered in the article on traceability failures with manual data.
A phased digitalisation plan
We approach digitalisation in short phases, each with a measurable result, within an architecture designed from the start to grow:
- Assessment. A walk round the plant with production, maintenance and quality; an inventory of signals; the state of PLCs, networks and SCADA; and choosing the problem that costs most today.
- First phase: one line and one indicator. For example, stoppages on the packaging machine or the electricity consumption of the pellet mill. Before changing anything, a baseline is taken with the data already available, even if it is manual, so that you can compare afterwards.
- Real use. A few weeks in which the indicator is checked at the production meeting and someone acts on it. If nobody looks at it, you review the indicator or who receives it; you do not add another one.
- Extension. More lines on the same architecture and, after that, batch traceability, energy by cost centre and ERP integration.
The size of the first phase matters for a practical reason: a small phase is easier to finish on time, gives plant staff confidence and leaves a result on which to decide the next one. A project that tries to cover the whole factory at once takes a long time to deliver its first useful data, and priorities change in the meantime.
Common mistakes in digitalisation projects
These are scenarios that recur across the sector, not specific cases:
- Starting with the software. An indicators platform is bought and then it turns out that many signals do not exist or sit in PLCs with no communications.
- Moving the paper report onto a tablet. If the operator still types in the kilos and the stoppages, the data carries the same errors; only the medium changes.
- Indicators with no common definition. If each shift calculates OEE or waste its own way, the figures cannot be compared. The definition is written before the calculation is programmed.
- Joining the control network and the office network without segregating them. Taking plant data to the ERP opens a path between two networks that used to be isolated. The ISA/IEC 62443 series of standards deals with the cybersecurity of industrial automation and control systems and is a reference for designing that segregation [5].
- Nobody in charge after commissioning. A faulty sensor or a recipe that is not registered ends up spoiling the system.
Public funding to digitalise the plant
A Spanish national call designed for this, the Activa Industria 4.0 programme of the Escuela de Organización Industrial, offered SMEs in the manufacturing industry specialised advice with a digital assessment and a transformation plan; its application period closed on 14 May 2025 [6]. As of September 2026 we have not found another open national call with the same aim, so it is worth checking the regional ones before you start.
How we do it at ER Ingeniería
We build the layers from the bottom up: electrical panels, instrumentation, PLC and SCADA programming and, on top, our own SuitER industrial software, which covers the management side with several modules:
- SuitER Server connects the PLC network with the factory's management network and stores every piece of data in a database, in real time.
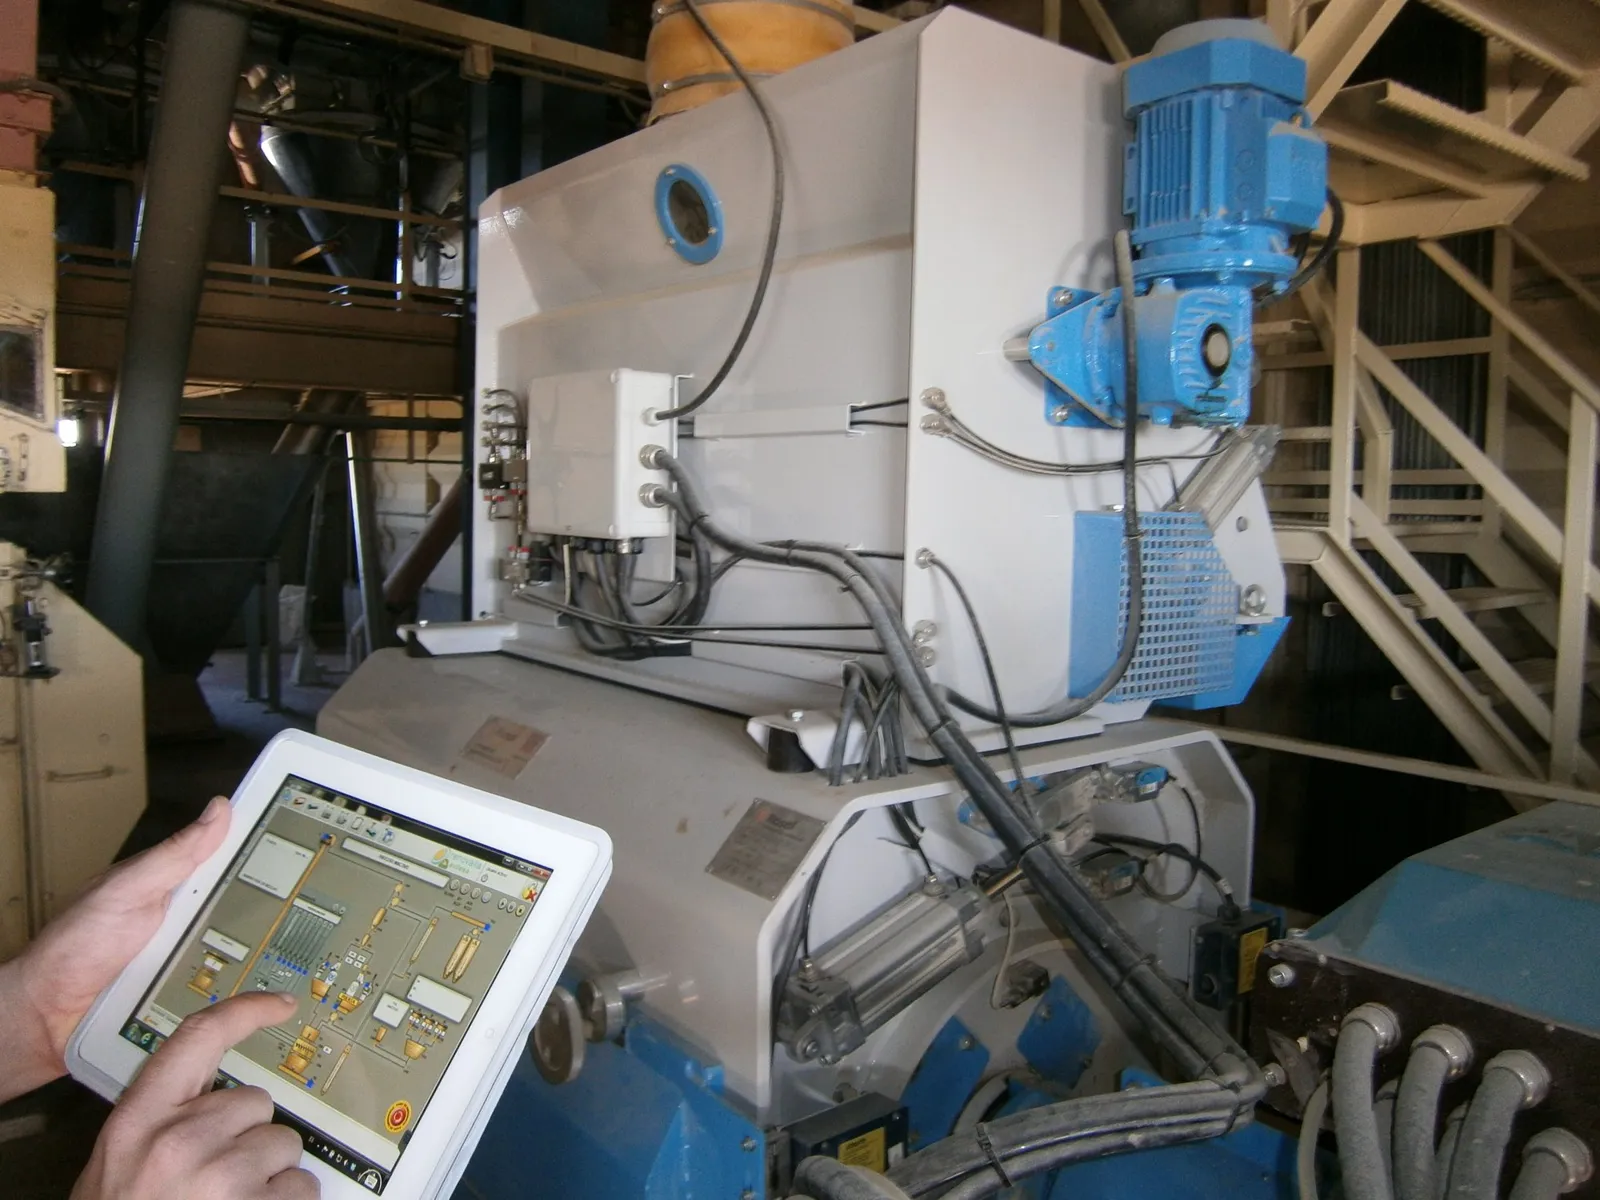
- SuitER Client brings factory control to any screen: control room, office, tablet or mobile.
- SuitER Reporter produces reports on any process and exports them as CSV, DOC, XLS or PDF.
- SuitER Tracer records each batch with its origin, formula and parameters, and tracks it from raw material to customer and from customer back to origin.
After commissioning, our SatER technical service stays with the plant. The 45 agri-food factories we have automated include those of Inalsa, Agrocantabria and Casaseca; some of them feature on our agri-food industry page. If your plant is a winery or a feed mill, we have specific articles on winery automation and feed mill automation.
Where shall we start in your plant?
Tell us what you make, which line gives you the most trouble and what data you have today. We will propose a well-defined first phase, with the indicator that measures it.
Discover SuitER Talk to our team Call us: 967 140 850Frequently asked questions about agri-food industry digitalisation
What is the digitalisation of the agri-food industry?
It means connecting the data of a food, beverage or feed plant in layers, from the sensor and the PLC to SCADA, MES and ERP, so that it is captured automatically at source and reaches the people who use it. That way decisions are made with real production, energy and quality data, not with manual reports.
Where do you start when digitalising a food factory?
With an inventory of signals on a specific line: which data is already in the PLC, which is in unconnected equipment, which is written down by hand and which nobody measures. The first phase should be small, with an indicator that can be measured before and after.
What is Industry 4.0 in the agri-food sector?
It is the name usually given to connecting machines, control systems and management systems so that information flows without being typed in. The ISA-95 standard (IEC 62264) is a standard way of organising that connection by levels, from the sensor to the ERP.
What is the difference between SCADA, MES and ERP?
SCADA supervises the process in real time. The MES manages manufacturing operations: production orders, batches, consumption and stoppages per shift or per batch. The ERP manages the business: sales orders, purchasing, stock and costs. In the ISA-95 model, the MES is level 3 and the ERP level 4.
How is a line's OEE calculated?
By multiplying availability, performance and quality, using the definitions in ISO 22400-2. For example, 87.5% availability, 90% performance and 98% quality give an OEE of 77% rounded. To calculate it you need machine data and planning data, which is usually held in the MES or the ERP.
Do you have to change your ERP to digitalise the plant?
Usually not. The ERP still handles orders, purchasing and stock; what changes is that it receives actual quantities, consumption and batches from the plant instead of typed-in data.
Is there funding to digitalise an agri-food business?
The EOI's Spanish national Activa Industria 4.0 programme, which advised manufacturing SMEs on their digital transformation, closed its application period on 14 May 2025. As of September 2026 we have not found another open national call with that aim; it is worth checking the regional ones.
Sources
- International Society of Automation. (n.d.). ISA-95 Standard: Enterprise-Control System Integration. https://www.isa.org/standards-and-publications/isa-standards/isa-95-standard
- International Electrotechnical Commission. (2013). IEC 62264-1:2013 Enterprise-control system integration. Part 1: Models and terminology. https://webstore.iec.ch/en/publication/6675
- OPC Foundation. (n.d.). OPC UA for Machine Tools. Part 1: Machine Monitoring and Job Management. Annex C.2: KPI Calculation (definitions taken from ISO 22400-2). https://reference.opcfoundation.org/MachineTool/v101/docs/C.2
- OPC Foundation. (n.d.). Unified Architecture. https://opcfoundation.org/about/opc-technologies/opc-ua/
- International Society of Automation. (n.d.). ISA/IEC 62443 Series of Standards. https://www.isa.org/standards-and-publications/isa-standards/isa-iec-62443-series-of-standards
- Escuela de Organización Industrial. (n.d.). Programa Activa Industria 4.0. EOI e-office. https://sede.eoi.es/oficina-eoi/tramites/acceso.do?id=8250