
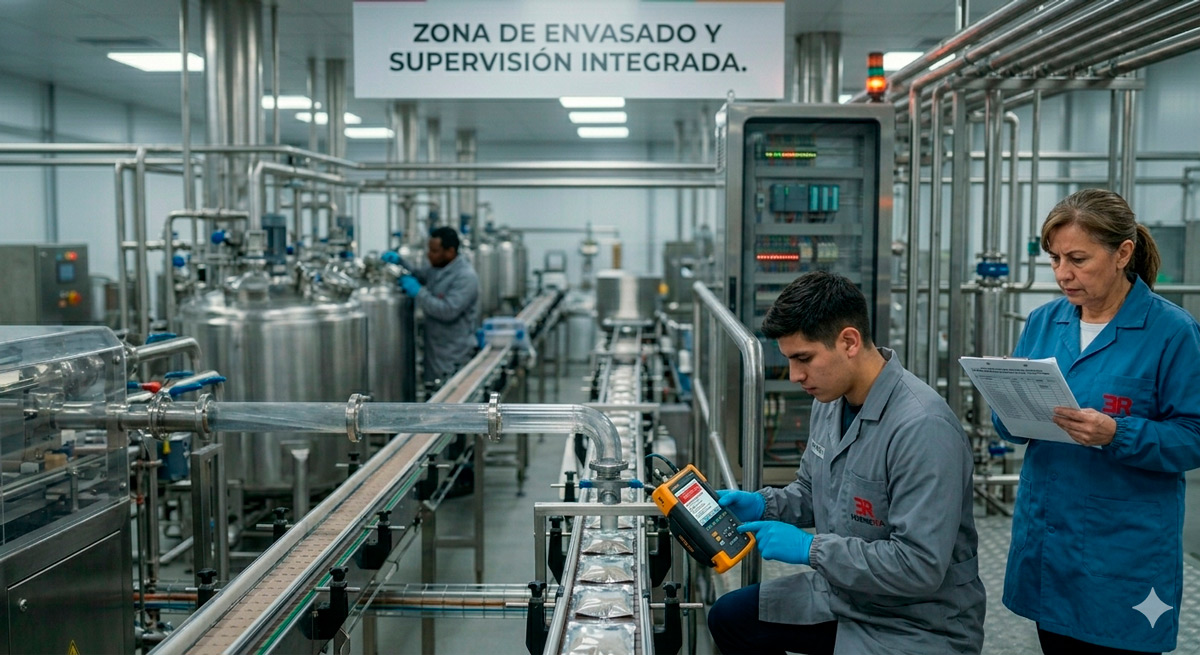
Technical document for calculating the real cost of an industrial production stoppage
The cost of a production stoppage is one of the indicators least rigorously measured and, at the same time, one of those that most affect a plant's profitability. In many factories, industrial stoppages are logged as operational incidents, but they are not translated into a complete economic measurement that allows investments to be prioritised, improvements to be justified or processes to be redesigned. When a line stops, it is not just time that is lost. You lose delivery capacity, operational efficiency, process stability, optimal energy consumption, staff availability, traceability and, in some sectors, product. That is why the calculation of industrial stoppage cost should be approached as a business control tool, not just as a technical maintenance data point.Technical index
- Technical introduction
- What it is and why it matters
- Industrial applications
- Key technical variables
- Selection criteria
- Comparison table of approaches
- Common mistakes
- Problem diagnosis
- Impact on production, energy and profitability
- Technical recommendations
- Technical checklist
- Access to the full technical document
- When to ask for technical advice
- Conclusion
- Frequently asked questions
Technical introduction
In an industrial plant, the economic impact of a stoppage is usually spread across different areas: production, maintenance, energy, quality, logistics and management. However, in many organisations each department interprets the problem from its own perspective. Production talks about units not manufactured, maintenance talks about breakdowns and repair times, energy spots inefficiencies in start-ups and consumption, while management needs to know which part of all this really affects margin and profitability. That fragmented approach makes decision-making harder. A line may stop for only a few minutes, but if the stoppage occurs in a bottleneck process, affects a critical product or forces reprocessing at later stages, its real cost can be far higher than basic records suggest. The same happens when an apparently minor incident causes loss of traceability, delayed dispatches or shift reconfiguration. From our experience at ER Ingeniería, analysing the cost of industrial stoppages works best when it is integrated with process control, plant data monitoring, automation and a business perspective. It is not just about knowing that the line has stopped, but about understanding what happened, where, why, for how long, with what impact and which technical action can reduce its recurrence.
Recommended approach: measure the cost of production stoppages as a cross-functional indicator. It should be connected to production data, PLC alarms, SCADA historians, maintenance events, shifts, batches, energy consumption and operational planning.
What is the cost of a production stoppage and why does it matter?
The cost of a production stoppage is the economic valuation of the impact generated when a machine, a line, an installation or a process stops operating as planned. This valuation must go beyond unproductive time and take into account direct and indirect costs.What does the calculation of industrial stoppage cost include?
In technical terms, the calculation should cover at least five dimensions:- Production loss: units, kilos, litres or batches not manufactured.
- Impact on resources: staff, auxiliary machinery, waiting times, technical intervention.
- Process impact: restarts, adjustments, cleaning, purging, reprocessing or losses.
- Energy impact: abnormal consumption at start-up, idle running or inefficiency during recovery.
- Business impact: delays, internal penalties, disruption to the production plan, loss of service or reduced margin.
Key criterion: a stoppage should not be assessed only by its duration, but by its position in the process, its frequency, its effect on the product, its capacity to spread to other stages and the cost of returning to stable operation.
Industrial applications
The analysis of factory stoppage losses is not applied the same way in every sector. Each industrial environment has specific variables that change how the real damage of an incident is measured. That is why it is important to adapt the methodology to the process.Wineries
Stoppages can affect pumping, receiving, fermentation, filtration, bottling, labelling and batch traceability. In these environments, the cost can include compromised product, campaign delays and loss of continuity in sensitive processes.Feed mills
A stoppage of conveyors, mills, dosing, mixing or pelleting systems directly affects throughput, formulation, recipe scheduling and traceability. Incidents can also create idle time in silos and dispatch.Food industry
On processing or packaging lines, a stoppage can affect perishable product, hygiene, batches, quality control and order fulfilment. The indirect cost is usually higher when there is waste or a need for reprocessing.Agro-industry
The impact varies with the harvest campaign, seasonality and dependence on supply. A stoppage during peak load can disrupt the entire planned processing capacity.Automatable plants
In facilities with several integrated pieces of equipment, a single breakdown can spread to later stages. Here it is essential to record field signals, alarms and sequences from the PLC and SCADA.Companies with high energy consumption
Shutdowns and restarts can have a direct effect on electricity consumption, demand, load peaks and the overall performance of the process. Without energy control, part of the cost stays hidden.
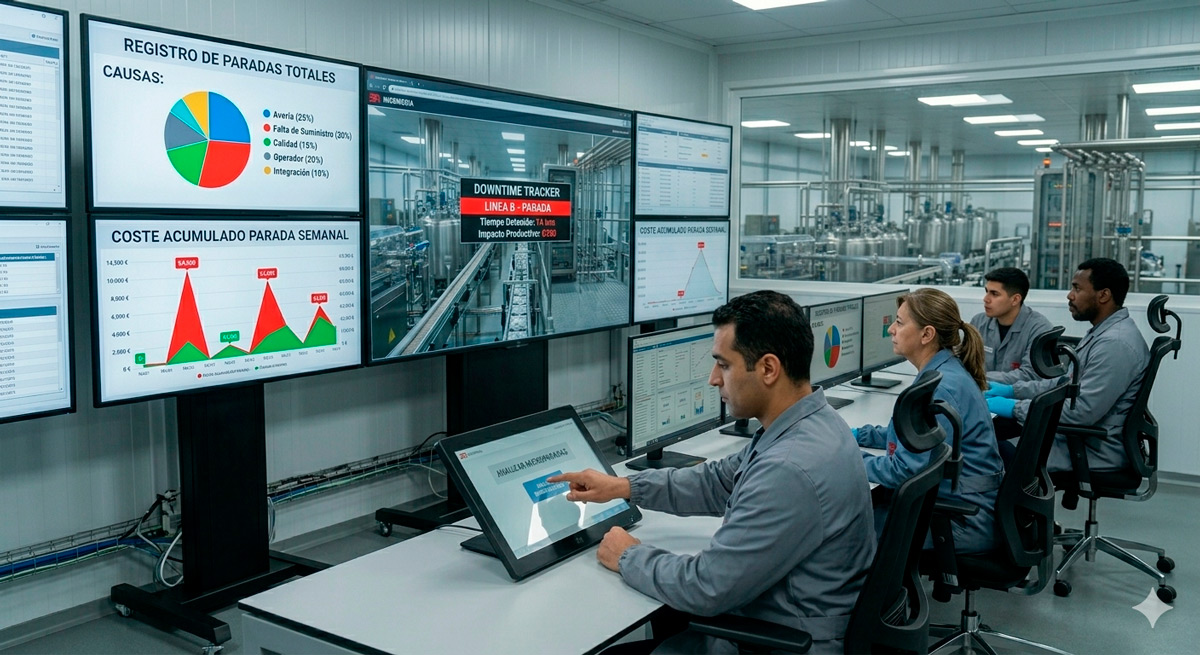
Suggested image: [Image of an industrial control room with SCADA screens and line supervision] Suggested alt: control room with SCADA system for tracking industrial stoppages and production Suggested URL: search Unsplash or Pexels for images of “control room industrial”, “SCADA”, “factory monitoring” or “industrial operations center”. Context of use: visual support to link stoppage calculation with digitalisation, plant data and operational supervision.
Key technical variables for calculating industrial stoppages
The quality of the calculation depends on the quality of the variables used. When data is captured manually, without consistent criteria or synchronisation with plant reality, the analysis loses reliability. The most relevant variables are usually the following.1. Actual stoppage time
A distinction must be made between total stoppage, micro-stoppage, reduced speed, waiting for product, waiting for an operator and scheduled stoppage. Not all unproductive time is of the same nature or has the same impact.2. Affected production capacity
It is not enough to know how long the line was stopped. You need to know its nominal rate, its actual rate at that moment and the volume of production not achieved during the incident.3. Type of product or batch in progress
The cost of the stoppage changes with the value of the product, the state of the process, the sensitivity of the batch and the criticality of the associated order.4. Impact on quality and traceability
In the food or agro-industrial sector, a stoppage can affect batch records, process stability, mixes, dosing, residence times or parameter validation. This has an economic and operational impact.5. Recovery cost
This includes restart, readjustments, purging, calibration, cleaning, validation, product disposal or additional time until stable production conditions return.6. Associated energy consumption
Restarts, idle running, losses in thermal or electrical efficiency and repeated cycles can raise the real cost. This factor is often left out of the basic calculation, which is a common mistake.7. Availability of staff and maintenance
The use of operators, maintenance technicians or external personnel to resolve the incident must also be valued. It is not just the machine downtime, but the cost of all the resources mobilised.8. Frequency and recurrence
A short but repetitive stoppage can have a greater annual impact than a single serious breakdown. That is why it is important to work with historical data and not just isolated incidents.| Variable | What it adds to the calculation | Risk if not controlled |
|---|---|---|
| Stoppage time | Measures duration and lost availability | Incomplete view of the operational impact |
| Production not achieved | Quantifies the effective loss of the process | Underestimating the economic cost |
| Affected product | Links the incident to the real value of the batch | Applying imprecise average costs |
| Energy consumption | Detects inefficiencies during shutdown and restart | Missing a relevant part of the extra cost |
| Losses and reprocessing | Captures indirect quality losses | Calculating only time and not the full damage |
| Root cause | Makes it possible to prioritise corrective actions | Incidents recurring without any learning |
| Historians and KPIs | Helps compare by line, shift or period | Being unable to justify investments |
Good practice: if the plant already has PLCs, SCADA or monitoring software, it is worth automating event capture to avoid recording bias. When that data is also centralised in an environment such as SuitER, the reading of stoppages can be connected with production, energy, historians and key indicators.
How to choose the right solution to measure and reduce the cost of an industrial stoppage?
Not all plants need the same level of intervention. In some cases it is enough to improve how incidents are captured and classified. In others, the problem calls for automation, machinery integration, PLC upgrades, SCADA deployment or additional energy monitoring.Selection criteria
- Process complexity: the greater the interdependence between pieces of equipment, the more necessary an integrated data system becomes.
- Line criticality: bottlenecks or continuous processes require greater measurement accuracy.
- Current level of digitalisation: if recording is still manual, prioritise automatic capture and reliable classification.
- Need for traceability: particularly important in food, wineries and batch processes.
- Production-energy relationship: if stoppages affect significant consumption, energy control should be added.
- Technological obsolescence: old equipment or equipment without connectivity makes diagnosis and continuous improvement difficult.
- Customer's in-house capacity: some plants need an external technical partner to define the right architecture.
Typical technical decision: if a factory already has basic automation but lacks analytical context, it is usually more cost-effective to improve integration, historians, alarms, incident classification and control panels before adding more equipment without real visibility of the process.
Solutions that may be involved
- Structured system for recording stoppages by cause.
- Automatic capture from PLC signals and machine states.
- SCADA for visualisation, historians and alarms.
- Industrial software to centralise production, energy and maintenance.
- Integration of standalone machinery into a single control logic.
- Technology migration of obsolete systems.
- Maintenance plan oriented to criticality and recurrence.
- Technical audit of the process to determine the real origin of losses.
Comparison table of approaches to calculating industrial stoppage cost
| Approach | Level of accuracy | Advantages | Limitations | Best fit |
|---|---|---|---|---|
| Basic manual recording | Low | Quick to implement | Human error, little granularity, low reliability | Plants with low digitalisation and an initial need for order |
| Structured recording by cause | Medium | Improves classification and trend analysis | Depends on operational discipline | Processes with detectable repetitive incidents |
| Automatic capture from PLC/SCADA | High | Objective data, alarms, historians and synchronisation | Requires technical integration | Automated plants or plants undergoing modernisation |
| Monitoring integrated with industrial software | Very high | Connects production, energy, traceability and KPIs | Needs correct modelling of the process | Companies that want to make continuous improvement decisions |
| One-off technical audit | Variable | Reveals underlying causes and helps prioritise actions | Does not replace permanent monitoring | Factories unsure where their biggest losses are |
Common mistakes when calculating factory stoppage losses
Many analyses fail not for lack of data, but for lack of technical judgement to interpret it. These are some common mistakes.Automating without defining production objectives
Installing control or data-capture systems without defining which decisions they should improve leads to dashboards with lots of information and little use.Not integrating existing machinery
When each machine generates its own data with no overall logic, the stoppage analysis is fragmented and does not help you understand the real sequence of the problem.Relying on manual data
Records written or entered after the fact are usually incomplete. They also rarely reflect micro-stoppages, speed changes or real recovery times.Not measuring actual energy consumption
A stoppage can have a considerable energy impact, especially in processes with motors, pumping, industrial refrigeration, compressed air, mechanical conveying or frequent restarts.Not connecting production and energy
It is common to treat the two separately. Yet a plant can improve its operating cost by correlating line availability, performance and consumption per unit produced.Choosing software without plant integration
If the tool does not connect to PLCs, SCADA or real signals, data quality will depend on manual entry or partial integrations.Not planning the migration of obsolete systems
Some plants try to analyse stoppages with old equipment that offers no reliable events, accessible historians or room for expansion.Not considering maintenance and support
Measuring the cost of stoppages without reviewing the maintenance strategy limits the ability to reduce incidents in a sustained way.| Mistake | Technical consequence | Economic consequence |
|---|---|---|
| Measuring only stoppage minutes | Lack of process context | Undervaluing the real impact |
| Not recording root cause | Corrections are not prioritised | Avoidable losses recur |
| Not including start-up and recovery | Partial view of the event | Hidden cost not accounted for |
| Not linking to batch or product | Loss of analytical traceability | Misleading average costs |
| Not integrating energy data | No complete reading of the process | Invisible extra costs |
| Using obsolete technology | Difficulty in historising and analysing | Reduced capacity for continuous improvement |
What technical diagnosis is advisable when industrial stoppages keep recurring?
When a plant detects recurrence, repairing is not enough. It is worth diagnosing the underlying pattern. The aim is not just to fix the current incident, but to reduce the likelihood of it happening again and to understand its cumulative impact.Useful diagnostic questions
- Is the stoppage concentrated in one line, shift, recipe, batch or specific piece of equipment?
- Is it a real breakdown, a process wait or a coordination failure between machines?
- Are there reliable, recorded alarms to identify the sequence of events?
- Does the stoppage affect a bottleneck or an auxiliary machine?
- Is the main impact on availability, quality, energy or traceability?
- Does returning to normal conditions require frequent manual intervention?
- Is there obsolete technology limiting control or analysis?
Root diagnosis: in many plants, the apparent cause of the stoppage differs from the root cause. A repetitive failure on a conveyor, for example, may be due to poorly tuned sequence logic, badly positioned sensors, missing proper interlocks or poor coordination between machines.
Impact on production, energy and profitability
Analysing the cost of stoppages is valuable because it connects plant reality with business profitability. When properly implemented, this approach improves the conversation between management, maintenance, production and energy teams.Impact on production
- Greater visibility of real capacity losses.
- Better identification of bottlenecks.
- Prioritising incidents by cost and not just by perception.
- Fewer operational errors and less dependence on manual interpretation.
- Better control of line performance and availability.
Impact on energy
- Detection of unproductive consumption during idle time or restart.
- Better analysis of cost per unit produced.
- Ability to correlate stoppage events with energy deviations.
- Greater capacity to audit abnormal behaviour.
Impact on maintenance
- Makes it possible to direct preventive or predictive maintenance towards genuinely critical assets.
- Makes it easier to justify technology upgrades or migrations.
- Reduces improvisation in recurring incidents.
- Improves planning of spare parts, interventions and support.
Impact on industrial profitability
- Makes it possible to prioritise investments on a technical and economic basis.
- Reduces hidden losses that do not show up in daily operating accounts.
- Improves the predictability of the plant.
- Helps you make decisions with data rather than isolated estimates.
Link to continuous improvement: a plant that measures its stoppages correctly can set up a continuous cycle of data capture, cause analysis, technical prioritisation, execution of improvements and verification of results. That cycle is much more solid when production, energy and maintenance share a common information base.
Technical recommendations
For the calculation of industrial stoppage cost to be useful and actionable, we recommend working with methodological prudence and an operational focus.- Define a taxonomy of stoppages: breakdown, micro-stoppage, waiting, supply shortage, changeover, cleaning, quality, reset or external intervention.
- Differentiate automatic data from declared data: both can coexist, but they must have validation rules.
- Link each stoppage to the affected process: line, equipment, product, shift and production order.
- Also measure recovery: the impact does not end at start-up, but when the line returns to a stable rate.
- Integrate production, energy and maintenance: without that overall view, part of the cost stays hidden.
- Use comparable indicators: by period, shift, line, product or family of incidents.
- Review system obsolescence: a lack of connectivity or reliable historians limits any improvement.
- Set intervention priorities: it is not always best to act first on the longest stoppage, but on the most costly or most recurrent.
Practical application: when the plant has SCADA, PLCs and an additional layer of industrial software such as SuitER, it is possible to centralise production indicators, alarms, historians, consumption and relevant events to build a more robust analysis of downtime cost.
Technical checklist
This checklist helps assess whether the plant is in a position to measure industrial stoppages correctly and reduce their impact.- There is a formal definition of what counts as a stoppage.
- Scheduled and unscheduled stoppages are distinguished.
- Causes are recorded using consistent criteria.
- The affected equipment, line and process are known.
- Actual start, end and recovery times are obtained.
- The event is linked to production not achieved.
- Whether the stoppage causes losses or reprocessing is analysed.
- Impact on traceability or quality is taken into account.
- Comparable historical data by period is available.
- The energy effect of shutdown and restart is reviewed.
- Automatic data is used whenever possible.
- Repetitive incidents are identified by root cause.
- Whether technological obsolescence limits the analysis is assessed.
- Operational KPIs have been defined for monitoring.
- The conclusions translate into concrete technical actions.
Access to the full technical document
The full version of this document may include extended selection criteria, a technical checklist, application analysis by process, integration recommendations, a review of energy and production variables, and guidance on assessing the most suitable solution according to production, energy consumption, traceability, maintenance and industrial profitability goals. Download Excel calculator
Recommended content for technical expansion: analysis of critical variables, incident diagnosis, comparisons of solutions, criteria for integration with the plant, assessment of industrial data and review of continuous improvement opportunities.
When is it advisable to ask for technical advice?
It is advisable to ask for technical support when stoppages have become normalised as part of day-to-day operations and there is no longer a precise view of their impact. Also when the plant suspects it is losing more than its current indicators show, but lacks reliable data to determine where to act first. In our experience, advice is especially useful in these cases:- The plant records incidents but cannot turn them into real cost.
- Data is scattered across production, maintenance and energy.
- There is non-integrated machinery or heterogeneous control systems.
- You want to justify an investment in automation, SCADA, PLCs or industrial software.
- You suspect the current technology is obsolete.
- Traceability losses or reprocessing are associated with stoppages.
- Management needs to prioritise improvements on economic and technical grounds.
Value of technical support: it is not just about measuring better, but about defining a viable solution for the plant, with criteria of integration, operational continuity and industrial profitability.